At the start of this year we expected the bull run in US equities to continue on the back of American exceptionalism and Trump’s deregulation and tax cuts agenda. So far, however, we have seen increased volatility and fear, causing the high-flying US equity market to struggle as a result of the potential implications of a tariff war.
Depending on which data you look at and what colour tinted glasses you have on, the US economy is perhaps more fragile than markets have predicted. Retail sales are slowing, services manufacturing index dropping, consumer confidence fell by 6.7% in February (the largest drop since 2021) and inflation is picking back up.
Most of this is “soft” data, which is generally very volatile and cannot be relied upon to give an accurate picture. Inflation has picked up, but the Federal Reserve’s preferred measure of inflation, the personal consumption expenditures index (PCE), came in slightly below expectations. Also, and perhaps more importantly, at some point with interest rates at higher levels the US economy was bound to give up some of its growth. Therefore some sort of moderation in growth should not have blindsided markets.
Still, while investors remain vigilant for any escalation in tariffs and for changes in the economic or political outlook, the long-term outlook for the US remains fairly strong.
While the Atlanta Fed’s economic growth tracker shows the US will experience a contraction of over 2% in the next quarter (due to a pickup in the US deficit), Goldman Sachs suggest this could in fact be owing to the huge volume of gold moving from London to the US over the last two months (gold is not included in the GDP calculation).
The main driver of markets in recent weeks has been Trump’s geopolitical and tariff threats, with the US economic uncertainty indicator shooting up. New tariffs imposed on China, Mexico and Canada, with retaliatory tariffs coming in response, have severely weighed on equity markets, with the higher-valued technology companies and more domestically-focused US equities feeling the pain.
Tariffs are expected to hurt US automakers significantly, with analysts estimating tariffs will add around $3,000 onto the price of a new car. Interestingly, if you look at how a car is assembled in the US, in some instances a car part can cross the border to Mexico multiple times before ending up in the finished product. It is therefore uncertain as to how these tariffs will actually be implemented in practice.
Europe in particular has experienced a good start to the year with investors pouring funds into the market. Reasons for this include a lack of US tariff threats in January, room for further interest rate cuts, much lower inflation levels and the potential for a ceasefire or some wider resolution of the Ukraine-Russia conflict. This is despite the rocky foundations that Eurozone economies sit on. Regionally there is much dispersion among countries, with Spain looking more attractive and economically strong than Germany – quite a change from a decade ago.
It is important to remember that economies and stock markets are not the same, and this is perhaps why we have seen the German Dax index shoot up this year while the economy remains in a stagnant state. Still, the outperformance of European markets is very short-term, and if we go back even five years the S&P 500 has outperformed the Stoxx Europe 500 by 43% in local currency terms.
Elsewhere in the world, Chinese technology companies have boomed this year amid improved Artificial Intelligence outlooks. Companies such as Alibaba have benefitted greatly from integrating AI into their offering and the Chinese government re-engaging publicly with technology leaders.
Still, the Chinese economy remains in uncertain territory (a key theme this year) with a downbeat property market and a low consumer confidence.
Closer to home, the past month has been relatively quiet for the UK. The FTSE 100 has continued to tick up slowly, while the more domestically focused FTSE AIM 100 has continued to decline in value. With an already stagnant economy, smaller businesses are expected to bear the brunt in April when both employer National Insurance contributions and the minimum wage increase.
The UK is also not immune from Trump’s threat of tariffs, with VAT a possible area in which the UK could come under fire.
And finally, in surprising news this month President Trump’s Department of Government Efficiency (DOGE), headed by Elon Musk, published details on how only so many US Federal employees can retire each month – because the retirement records are kept in a disused mine shaft. Meaning that if the elevator to the mine breaks down, no one can retire…
Areas of focus
- Chinese technology stocks have performed very well in recent weeks, boosted by the DeepSeek AI advancements.
- Although AI related stocks have suffered following the DeepSeek announcement, the need for AI infrastructure is likely to be just as large, improving the long-term prospects for the sector.
- UK smaller companies continue to struggle amid a difficult fiscal and monetary backdrop. The more internationally-focused FTSE 100 continues to deliver positive returns.
- Gold has continued its strong run this year as investors look for safety in this asset and Central Banks continue to buy the precious metal.
- Japanese stocks have stalled somewhat this year with further interest rate increases expected and a strong Yen hurting export demand.
- European stocks have rallied with financials and defence stocks experiencing big gains.
- Volatile cryptocurrencies have seen big falls in value since Trump’s inauguration, with the lack of policy announcements and general investor unease bringing prices down.
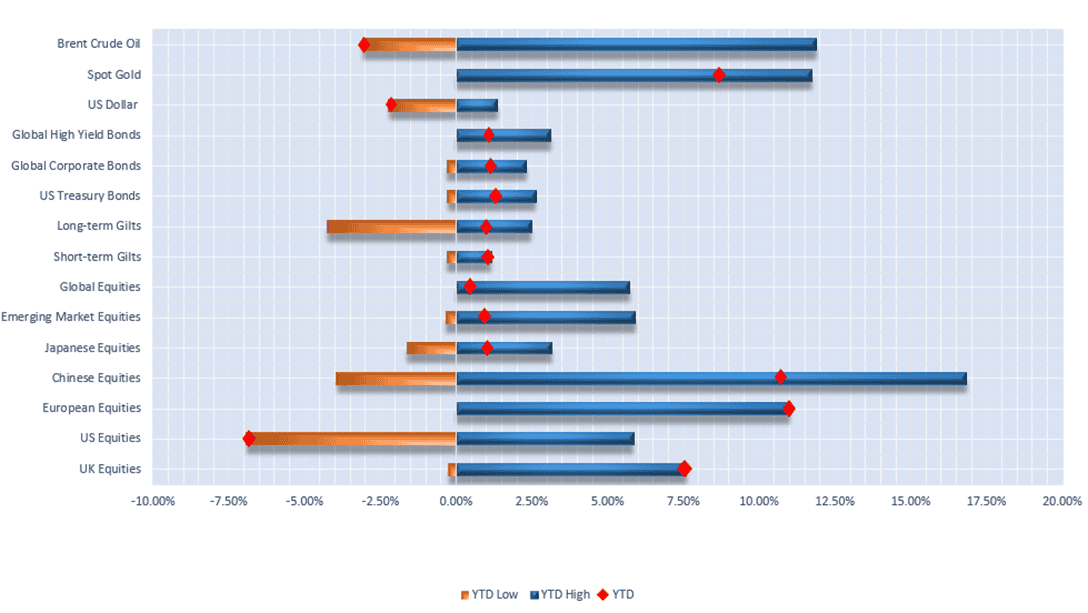
Selection of assets 2025 YTD returns and range of returns as at 06/02/2025 (the two ends of the bars represent the range of YTD returns and the red dots represent the current YTD return). Indexes used: FTSE All-Share, Russell 2000, STOXX Europe 600, MSCI China, MSCI Japan, MSCI Emerging Markets, FTSE UK Conventional Up To 5 Years, FTSE UK Conventional Over 15 Years, ICE BOFA US Treasury, ICE BOFA Global High Yield, ICE BOFA Global Corporate, US Dollar Index, S&P GSCI Gold Spot, S&P GSCI Brent Crude Spot. Returns hedged back to GBP with exception of US Dollar which is in US Dollar terms. Data from FE Analytics and MarketWatch.
USA
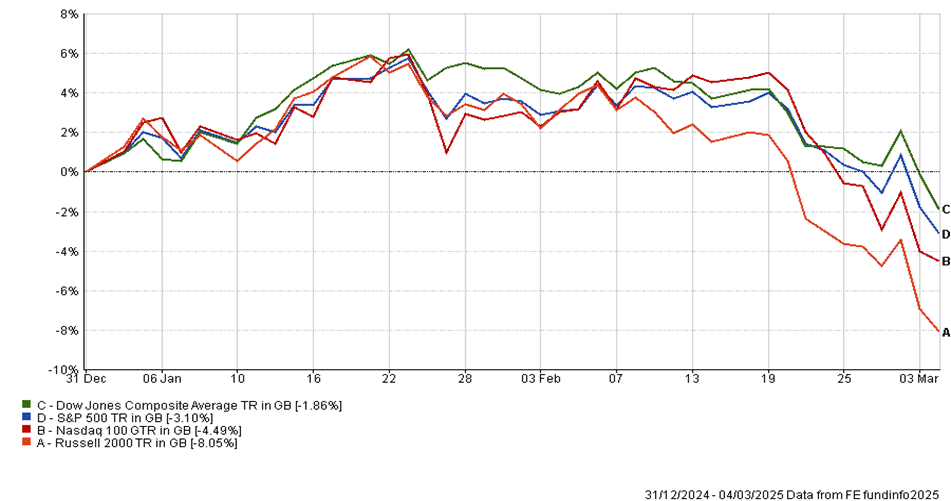
YTD performance of US equity indices (Source – FE Analytics)
The US continued to be the centre of attention in the world of investments during February. The four major equity indices finished the month in the red – the Russell 2000, which includes smaller market capitalisation companies, losing 6.62%. The S&P 500, Nasdaq 100, and Dow Jones Composite Average all shed between 2.54% and 3.97% and this decline has pushed the year to date returns for all four indices negative.
This shaky start to the year can be attributed mostly to markets’ least favourite word, uncertainty. Uncertainty in relation to the ongoing trade war Trump has started with the rest of the world, uncertainty on the future path of inflation and interest rates, and uncertainty with the US growth prospects. This has been amplified by the Atlanta Federal Reserve updating its real time GDP forecasting model to show an annualised decline this quarter of -2.80% (which compares with +2.30% last week).
Earnings season is now close to concluding with the leader of the AI bull market, Nvidia, smashing analysts estimates out of the park. The company was able to grow revenues by 78% in the quarter and gave Wall Street strong guidance for the current quarter. Nvidia now has a Price to Earnings (P/E) ratio of 44.65, which suggests that the company is priced for perfection and at present, perfection is what we are getting. The other names in the Magnificent Seven also are trading at rich valuations – the question going forward will be if they can be justified.
It is no surprise that Trump is making the news and moving markets, with his latest tariff threat aimed at all EU goods. We believe that this again will be all part of the Donald Trump play book of threating large tariffs to gain negotiation leverage.
Trump has also been active in Europe regarding the Russia-Ukraine conflict where he seeks to end the war with a Ukrainian compromise. The deal on the table is that US companies will be able to take an interest in Ukrainian mineral deposits, which in turn the US would want to protect. As widely covered, the meeting between Zelensky and Trump did not go according to plan and has caused ripples throughout the entire continent of Europe.
US CPI for January came in hotter than expected with a yearly rise of 3.0% and a monthly rise of 0.5%. This data reinforces Jerome Powell’s belief that rates must be held higher for longer than markets would otherwise like, and markets now price in the first cut of the year coming in June.
The other side of the Fed’s “dual mandate” (full employment) remains as expected with the US adding 143,000 jobs in January and the unemployment rate ticking down to 4.0%. Softer GDP data would also put pressure on the Fed to reduce rates further.
| 1st January 2025 | 5th March 2025 | YTD Change | |
| US 2 Year Yield | 4.26 | 3.98 | -0.28 |
| US 10 Year Yield | 4.56 | 4.25 | -0.31 |
| Dollar Index | 108.49 | 105.03 | -3.46 |
YTD changing in US bond yields and the US dollar index (Source – MarketWatch)
US bond yields have moved down slightly since the start of 2025 but are still much higher than where investors had expected them to be when the Federal Reserve started this rate-cutting cycle.
This can be mostly attributed the resilient US economy and inflation concerns, especially with Trump’s inflationary policies such as tariffs and tax cuts. The fact that the Fed has moved more slowly than other global central banks in this respect has also kept the dollar relatively strong. The US dollar weakening would be a tailwind for equity and bond investors alike (as an asset would increase in nominal value if the currency in which it is priced in decreases in value).
Newly sworn in Treasury Security Scott Bessent has explicitly expressed his aims for the dollar and bond yields, which matches the President’s rhetoric. A weaker dollar is favourable to make exports more attractive for foreign buyers, which will likely boost US GDP growth. This would result in lower bond yields, which would then help to tackle the US national debt burden as the cost of servicing the debt falls.
Bessent’s plan here is to issue more longer-dated bonds than the previous administration’s shorter term strategy. This may be feasible, as the longer out one looks on the yield curve, the less you are impacted by the pinning of base rates.
China
China certainly threw a spanner in the works for American Exceptionalism when DeepSeek announced its cheaper and more energy efficient AI model. The Hang Seng market and technology sub-indices rallied on this news (see chart below) along with reduced tariffs imposed by President Trump of 10%.
This has changed, however, as Trump has now said he will impose add 10% to existing tariffs on Chinese goods due to the flow of Fentanyl into the US, leading to a sharp drop in the Hang Seng index of over 3% (during 28th Feb trading session).
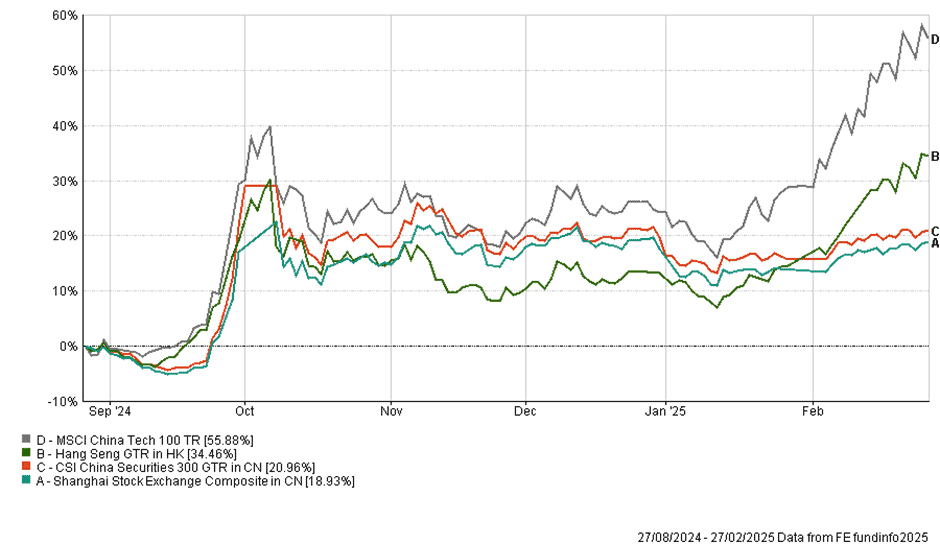
Six month performance of Chinese & Hong Kong stock market indices (Source – FE Analytics)
The Chinese economy has long been plagued by its struggling property market, low consumer confidence and potential slide into a deflationary environment. We saw in late September a jump in markets as the government announced fiscal stimulus to help the economy. Investors decided this was not enough and markets fell back down and remained stagnant until mid-January.
Part of the subsequent rise has been from the advancement in China’s AI capabilities. However, other factors for the increase include the fact that state-owned insurance companies were directed to hold more Chinese equities, increasing shorter term demand, along with the lower-than-expected tariffs imposed on China by the US.
So, the golden question remains, is the Chinese stock market an attractive proposition now?
Long-term China will continue to be mired in structural issues – the property slump, its ageing population, tariffs from Trump and political interference in business activity.
However, China has positioned itself well globally, with its Belt and Road Initiative and its Made In China 2025 strategy. China also controls around 90% of the world’s rare earth minerals (important components of many technologies such as smart phones, batteries and AI chips) giving it a huge advantage, and perhaps explaining why Donald Trump is so keen to control Greenland and its mountain of untapped natural minerals.
The benefit of China and state-owned enterprises is there is no return needed on their investments. This has allowed China to make overseas investments and build up its mineral and infrastructure control, something the US has fallen behind in doing.
While China has improved its technological developments, it still falls short in terms of hardware, giving the US the edge in this area. For example, recent news has shown that Huawei has improved the percentage of functional chips that it can produce to nearly 40% (this figure was around 20% a year ago). That said, this is still below the industry benchmark of around 60%.
With the US continuing to impose export controls on advanced chips going to China, they will still be reliant on software advances to compete with US companies.
That being said, recent reports in the Wall Street Journal have shown that Chinese companies are bypassing these restrictions by buying (at a premium) chips from suppliers in other countries which do not have export controls in place.
Although a relatively small amount compared to the volume companies such as Alphabet have been purchasing, this does show that Chinese companies one, can get their hands on advanced chips, and two, Trump’s export restrictions and tariffs will be much more difficult to implement.
At some point China will become self-reliant and on a level footing with the US in many industries. Another such example is the Chinese space industry – while China has successfully landed a rover on Mars, recent comments from a private Chinese space company acknowledged that SpaceX has the competitive advantage and Chinese companies are optimistically looking to reach a similar level by 2030.
On the face of it, therefore, the long-term prospects for China look good. This does not mean the returns from stock markets will follow suit and on a long-term view we remain cautious on the region.
Over the short-term we expect the technology excitement to continue to drive markets higher, with tariff threats from Trump pulling the indices back down, netting in a volatile and stagnant market.
Europe
Eurozone equities continued to perform well in February, despite external trade vulnerabilities such as the ongoing threat of potential tariffs from the Trump administration and continuing difficult economic conditions. Looking ahead, potential tailwinds for Europe in the next few months include increasing government spending on defence, the relaxing of fiscal policy in some countries, and the potential for de-escalation in the Ukraine war.
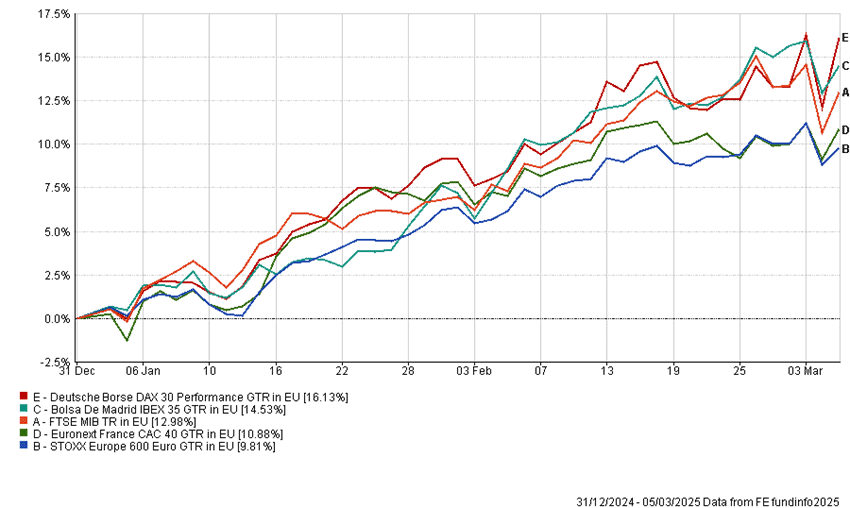
YTD Performance of major European stock market indices in Euros (Source – FE Analytics)
The European Central Bank’s key interest rate remains at 2.75% with an additional rate cut predicted this month. Meanwhile, inflation (as measured by the HICP index) eased by 0.1% to 2.4% in February.
Eurozone economic growth remains poor, despite a slight improvement at the start of 2025. The HCOB Eurozone Composite PMI, a seasonally-adjusted marker of overall economic health, held at 50.2 in January, just above the 50 threshold separating growth from contraction.
In Germany, Friedrich Merz, the newly elected Chancellor-in-waiting, reached an agreement with his likely coalition partners to overturn the “debt brake” rules implemented in 2009 which currently limit government borrowing and caps the structural deficit at 0.35% of GDP.
This deal aims to stimulate the economy by investing in military capabilities and infrastructure, aiming to reboot growth following two consecutive years of economic contraction in 2023 and 2024. Following this announcement, the yield on the 10-year Bund surged over 20%, its largest swing since 2020 as investors brace for extra borrowing from the government and hopefully, a boost to Germany’s economic growth.
Previously, Germany’s 10-year bond has represented the risk-free asset benchmark for the whole of Europe, but German bonds have been rare due to limited issuance. Additional spending could now prompt more government bond issuance, creating upward pressure on bond yields and a reciprocal drop in bond values.
As mentioned earlier, the STOXX 600 (an index tracking Europe’s 600 largest companies) has outperformed the S&P 500 this year to date.
In recent weeks Europe’s defence stocks have been the biggest winners, fueled by expectations that EU governments will follow the United Kingdom’s pledge to boost defence spending in light of the US administration’s drastic changes to foreign policy and the ongoing conflict in Ukraine. Notable examples include Rheinmetall in Germany (rising over 90% YTD), but also the Stoxx Europe Aerospace & Defence index has climbed more than 30% this year.
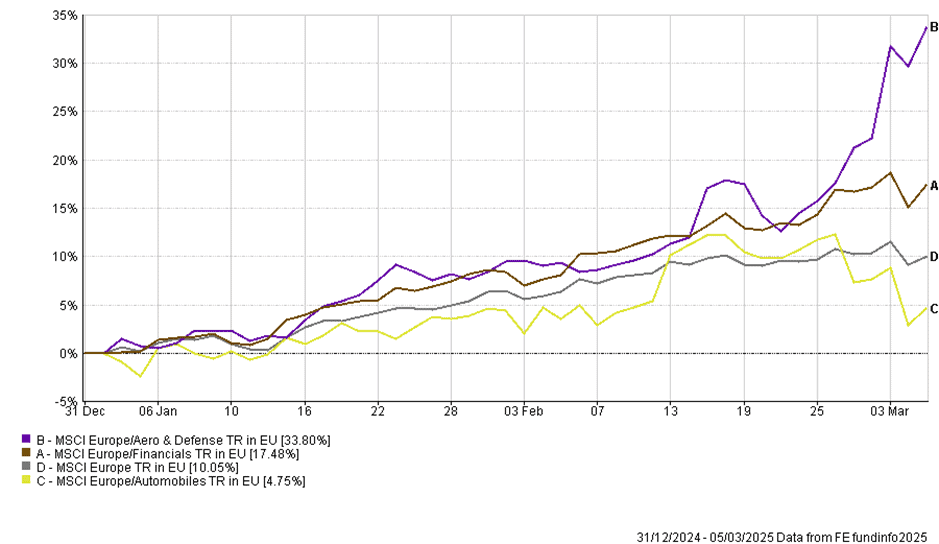
YTD performance of select European stock market sectors in Euros (Source – FE Analytics)
European markets have demonstrated resilience, in part due to the diversification opportunities they offer combined with President Trump’s lag in implementing any ‘day-one’ tariffs on EU exports, however, this may have falsely reassured investors that tariffs will be diluted or may not be implemented at all.
However, this optimism has been tempered by Trump’s most recent announcement on EU tariffs last week promising implementation soon. Although details remain vague, tariffs are expected to be set at approximately 25% on EU exports to the US, targeting cars amongst other goods. This statement has already had a significant impact on European car manufacturing stocks such as Germany’s Volkswagen, Mercedes-Benz, Porsche, and Stellantis, as heavy tariffs would render exports to one of the world’s largest auto markets significantly less profitable.
The Kiel Institute for the World Economy speculates that 25% tariffs on EU exports to the US could lead to a drop in exports of between 15-17%, with a knock-on contraction of the EU economy of 0.4% and the US of 0.17%. The full impact of these tariffs remains unclear until the details are finalised in the coming weeks, and it is therefore uncertain whether they will reverse the positive start to the year seen in European equities.
While European stock markets have been flying, their respective economies are still struggling. This difference in performance is attributed to the fact that stock markets are often not representative of domestic economies. In the UK for example, the FTSE 100 companies derive a significant proportion of their revenues overseas (particularly in US Dollars), and so the if the UK economy is struggling it does not necessarily mean that the FTSE 100 will do likewise.
The same is true for Europe. The companies in the Stoxx 600 derive an estimated 22% of their revenues from the US, with Spain and Italy being less reliant on revenue from the US than France or Germany. Therefore although the state of an economy is a factor, markets can still move higher despite their domestic economies struggling.
Smaller company (“small cap”) indices tend to be more representative of their local countries as their revenues are more aligned with domestic spending, investment and consumption.
In summary, while Eurozone equities have shown good resilience in February, the future remains uncertain due to the looming threat of tariffs, sluggish economic growth, and geopolitical tensions. This is balanced against the potential for increased defence spending, fiscal relaxation, and a de-escalation in the Ukraine conflict, which provide reasons for cautious optimism.
European markets appear to be weathering the turbulent conditions for now, but investors will need to closely monitor the evolving tariff situation, as this could significantly impact European trade, and therefore market performance in the near term. The next few months will be crucial in determining whether this positive momentum can be maintained.
UK
UK inflation accelerated in January to 3% as service inflation continued to rise. This marked a sharp incease from December’s CPI figure of 2.5%. Wages in the UK also remain elevated, with annual growth increasing by 5.9% in the final three months to December.
In January, the Bank of England had forecast CPI rising to 3% later this year but recently published data suggests this may have been an underestimate. The Bank of England have now revised its figures and sees inflation rising to 3.7% this year. Previous forecasts for an additional three rate cuts by the end of the 2025 now appear somewhat optimistic.
According to the S&P Global purchasing managers’ index (PMI) in February, UK service sector businesses have reduced employment for the fifth consecutive month – the most prolonged period of job cuts since 2011 (exluding COVID-19). Economists have described the trend as a “loss of growth momentum” since the Autumn budget, with the increase in National Insurance contributions and the upcoming rise in the minimum wage described as the major factors.
The Office for Budget Responsibility (OBR) is expected to warn Rachel Reeves that her £9.9bn margin for error has eroded since the Autumn budget due to rising bond yields and lower GDP forecasts. The Chancellor is now focusing her attention on public spending cuts as we approach the Spring Budget on 26th March, with welfare spending expected to be cut by billions.
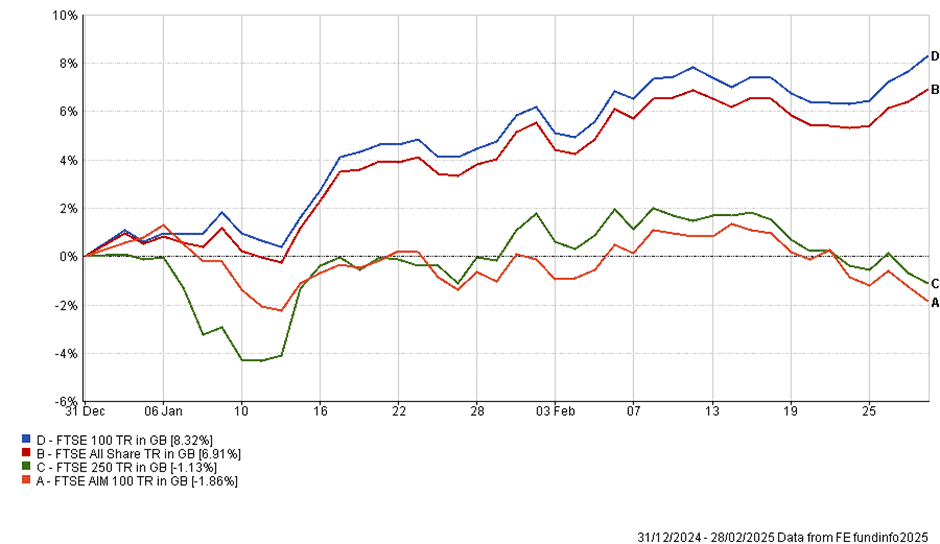
YTD performance of major UK stock market indices (Source – FE Analytics)
Despite this uptick in inflation and bleak economic outlook, the FTSE 100 continued to rise in February – increasing by 8.32% year-to-date and hitting fresh all-time highs. As mentioned above, the returns from this index are not hugely dependent on the fortunes of the UK economy.
Recent geopolitical events have sparked a rally in defence stocks, which has supported the index. Kier Starmer recently announced an increase in UK defence spending to 2.5% of GDP, which has helped to boost defence stocks higher.
The FTSE 100 has also been helped by a weak pound recently. This is because many of the companies in the FTSE 100 are multinational corporations and around 70% of FTSE 100 revenues come from outside the UK. When the pound falls in value, overseas earnings are worth more, UK exports become more attractive, and a weaker currency makes UK stocks cheaper and more appealing to international investors.
The smaller cap FTSE 250 and FTSE AIM indices, which are more exposed to the UK economy, have failed to gain traction in the same way as larger cap UK equities this year and remain in negative territory owing to higher interest rates and lower internal demand.
However, the UK government has recently announced plans to reduce regulation for new defence contacts, making it easier for smaller business to benefit from the increased government expenditure in the sector. It is hoped that this could bolster demand amongst some UK smaller companies in the sector and subsequently help their share prices.
Rising fears over inflation caused UK gilt yields to increase again in February as the potential for fewer rate cuts weighed on investors. Despite this, gilt yields remain lower than they were at the start of the year, with shorter dated gilts falling the most.
| Yield as at 04/03/2025 | YTD change | |
| 2Y Gilt | 4.12% | -5.94% |
| 10Y Gilt | 4.44% | -2.84% |
UK bond yields and YTD change as at 04/03/2025
Japan
Japanese economic growth accelerated in the final quarter of 2024, with GDP expanding by 0.7%, marking a return to positive economic growth in the region. While domestic consumption remains somewhat fragile, robust exports and increased business investment have provided significant support to the Japanese economy.
A key driver of this growth has been a sustained shift towards wage increases exceeding inflation. In 2024, average wages rose by 5.3% and economists anticipate this year’s wage settlements will average 4.9%, as labour shortages continue to exert upward pressure on pay.
Following a prolonged period of deflation, price increases now appear to be sticking in Japan, with CPI inflation reaching 3.6% in December. In response, the Bank of Japan raised interest rates to 0.5% in January, as rising wages and prices create conditions for the gradual normalisation of monetary policy.
Market expectations now point to further rate hikes in 2025, which have contributed to a strengthening of the yen. This should help to boost returns in the region for overseas investors.
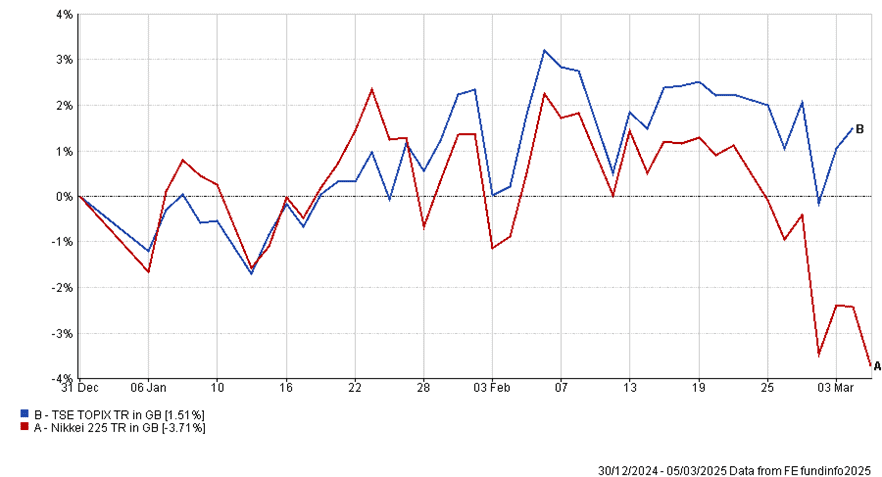
YTD returns of major Japanese stock market indices (Source – FE Analytics)
Japanese equities suffered in February, with the Nikkei 225 falling by 6.1% and the TOPIX falling by 3.8%.
The Nikkei experienced sharper declines due to troubles in semiconductor-related companies, which account for a larger proportion of the index relative to the TOPIX. Shares in the largest companies were particularly affected in February, with smaller and mid-cap stocks outperforming in relative terms.
Global trade tensions weighed on investors and caused a broad slump in Asian equities. Amid these uncertainties, the yen, which is seen as a safe-haven currency, strengthened and added pressure on Japanese exporters, making their goods and services more expensive overseas. This added further downward pressure on Japanese equities over the month.
Also announced in February was the breakdown of the planned merger between Nissan, Honda and Mitsubishi. The merger would have created an automotive group worth $60bn – the world’s fourth largest by vehicle sales behind Toyota, VW and Hyundai. The collapse of the merger leaves Nissan with significant financial hurdles, following slowing sales and turmoil among its top executives, with reports indicating that the company may have only 12 months left to survive.
While there are some clear short-term headwinds in the market, Japanese equities have shown resilience and are being supported by ongoing structural reforms and improvements in corporate governance.
Driven by rising inflation expectations in the region, the yield on 10 Year Japanese Government Bond’s is now 1.51% – the highest level since 2009 and an increase of 38.33% year-to-date.
Robert Dougherty, Investment Specialist
Ryan Carmedy, Associate IFA
Harry Downing, Associate IFA
Fiona Chegwidden, Graduate Trainee IFA
March 2025
This article is not a recommendation to invest and should not be construed as advice. The value of an investment can go down as well as up, and you may get less back than you invested.